


2018 School Spending Survey Report
Design Trend: Social Spaces | Year in Architecture 2024
Libraries continue to emerge from the pandemic, with spaces designed to promote social interaction along with quiet study—places that work for everyone.
DESIGN TREND: Social Spaces
Libraries continue to emerge from the pandemic, with spaces designed to promote social interaction along with quiet study—places that work for everyone. Accessibility is an essential factor; libraries include options that address the needs of diverse users. Bobst Library at New York University collaborated with students who identified as disabled or neurodivergent to enhance its central atrium with sensory-friendly details such as warm pendant lighting, sound-dampening surfaces, and calming color palettes.
Libraries continue to expand choices, not only in the variation of spaces but through furniture types and configurations, to support a continuum of activity. The renovation of Countway Library, Harvard Medical School, Cambridge, MA, encompasses the addition of a café and bookstore where lively conversations can take place. With the rise of collaborative projects and preference for study groups, libraries are building larger study rooms that include long tables. These can also serve as shared communal seating, so that individuals studying might engage in casual connections with others at the same table. The Wallace Library, Rochester Institute of Technology, NY, reimagined its design to align with a new role on campus as a “third space” for student life. Users can choose from lounge seats with low tables, couches, or even bistro high tables with stools to best fit their preferences for studying or socializing. These study areas are placed along circulation corridors to promote visibility for chance encounters.
Public libraries that serve broader audiences have developed areas of belonging for specific subgroups, such as teen spaces. In the Reynoldsburg Branch Library, Columbus Metropolitan Library, OH, thoughtful layouts encourage interaction. Combination counter and bench seating positioned toward a large screen sets up an opportunity for group viewing of films or sporting events. Shelves of young adult books and media along the perimeter walls become a destination point where informal conversations might happen. A foosball table is centrally placed with space for onlookers to gather around.
BACK TO YEAR IN ARCHITECTURE 2024 LANDING PAGE
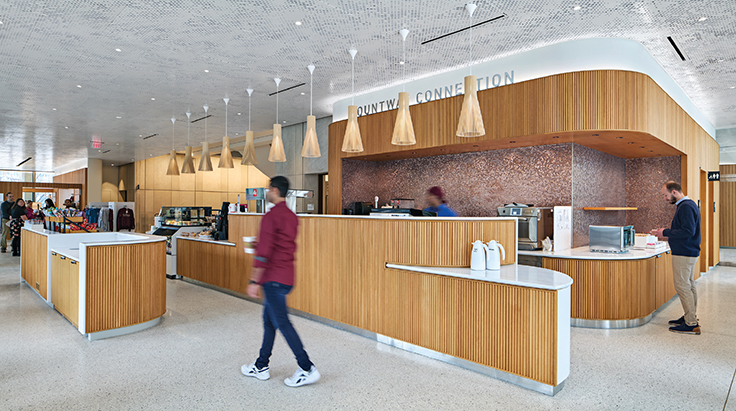 |
Countway Library, Harvard Medical School, Cambridge, MA; Shepley Bulfinch, architect; Robert Benson, photo. |
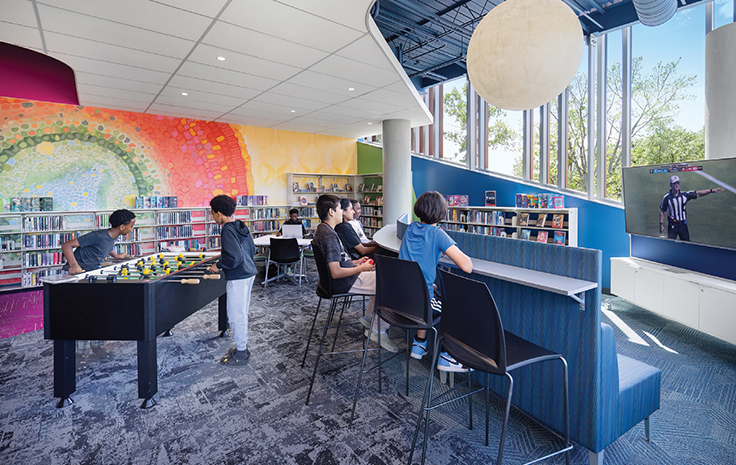 |
Reynoldsburg Branch, Columbus Metropolitan Library, OH; Gund Partnership, Jonathan Barnes Architecture & Design, and Margaret Sullivan Studio, architects; © Brad Feinknopf/Feinknopf 2024, photo. |
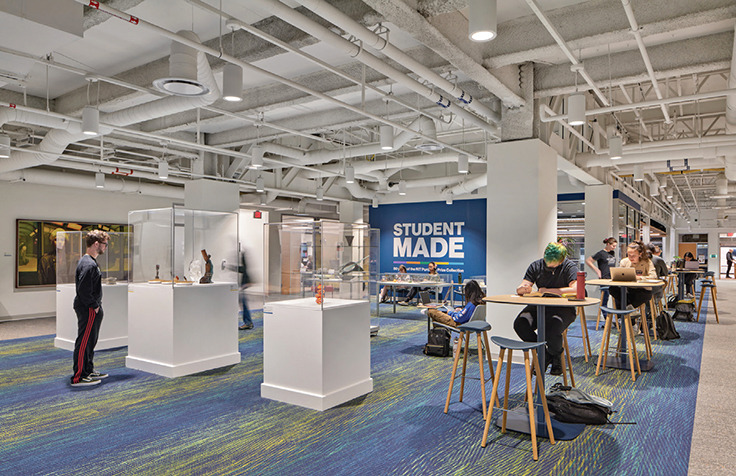 |
Wallace Library, Rochester Institute of Technology, NY; William Rawn Associates Architects and MRB Group, architects; Robert Benson, photo. |
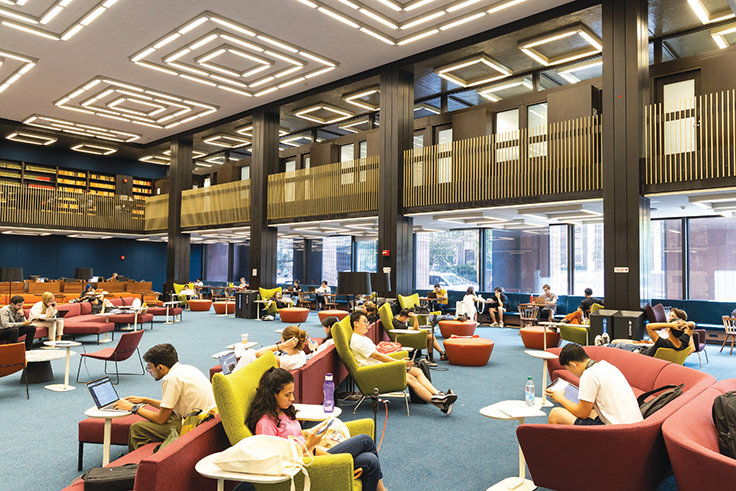 |
Bobst Library, New York University, NY; Tod Williams Billie Tsien Architects/Partners, architect; ©Hollenshead: courtesy of NYU Photo Bureau, photo. |
undefined says
Is it possible to get the Mean and Standard Deviation values you used across the key metrics for the LJ 2022 star ratings of libraries in the $10M-$29.9M with a LSA of 100k-250k? If I use the posted data for star libraries reported, using your formulas, I don't get anywhere near the same scores. I assume it is because I am using a small sample of 13 libraries to calculate the Mean and StdDev.
For example if I calculate the Mean & StdDev for the libraries in the $10M-$29.9M category with a LSA of 100k-250k (13 libraries) and use that for the calculations
(((Lib data -Peer Pop Mean) / Peer Pop StdDev) +8) *100 I get a Score of 1,551 for Naperville instead of the 2,669 in the report. I do sum the scores for each category before I add the 8 as shown below
Naperville Public Library
Physical Circulation 22.52
Minus Physical Circulation Mean 11.73
= 10.79
Divided by Physical Circulation StdDev 6.98
score for circulation = 1.551
Circ Score 1.55 Em Score -0.05 Visit Score 2.71 Prog Attnd Score 1.09 Comp Use Score 1.82 Wi Fi Session Score 0.39 ER Score Raw 2.14 Score Sum 7.51 + 8 = 15.51 x100 = 1551
And so on for each key category. The results for each category are added up, 8 is added and that sum multiplied by 10 as per your 7 Step "Score Calculation Algorithm"
Add Comment :-

Added To Cart
RELATED


RECOMMENDED


TECHNOLOGY

ALREADY A SUBSCRIBER? LOG IN
We are currently offering this content for free. Sign up now to activate your personal profile, where you can save articles for future viewing
ALREADY A SUBSCRIBER? LOG IN
Thank you for visiting.
We’ve noticed you are using a private browser. To continue, please log in or create an account.
