


2018 School Spending Survey Report
Outcomes, Impacts, and Indicators
The Impact Survey was first used in 2009 to help gather data for the Opportunity for All study reports, conducted by the University of Washington’s iSchool with assistance from the Bill & Melinda Gates Foundation. Libraries were enlisted to connect to a web survey, the results of which were used to augment responses gathered through a telephone-based poll. To our surprise and delight, we gathered more than 45,000 survey responses in just ten weeks, with about 400 libraries participating. Even more delightful was finding that libraries were using the data from Opportunity for All as well as the reports of Impact Survey results from their own communities.
The Impact Survey was first used in 2009 to help gather data for the Opportunity for All study reports, conducted by the University of Washington’s iSchool with assistance from the Bill & Melinda Gates Foundation. Libraries were enlisted to connect to a web survey, the results of which were used to augment responses gathered through a telephone-based poll. To our surprise and delight, we gathered more than 45,000 survey responses in just ten weeks, with about 400 libraries participating. Even more delightful was finding that libraries were using the data from Opportunity for All as well as the reports of Impact Survey results from their own communities.
Now, six years and several versions later, the Impact Survey is still showing the value of public access technology in libraries, and more libraries than ever are taking advantage of having outcomes, impacts, and indicators ready to measure with just a little bit of copying and pasting. Is this the future of outcomes-based evaluation in public libraries? For the sake of librarians worldwide who struggle with evaluation, particularly figuring out what to measure, the researchers at the iSchool’s Technology and Social Change Group/US IMPACT Study (TASCHA/US IMPACT) research group certainly hope so!
Demonstrating what we do
The story of measuring the impact of public and nonprofit programs fills the shelves of libraries. It is the topic of endless webinars, conference sessions, and articles—and frustration for program managers. Despite all the attention and advice about program evaluation, those responsible for carrying it out still struggle to define their program outcomes, connect those to their program goals (impact), and figure out how to measure them (indicators).
The public library field is among those struggling to articulate what we do in the terms and language of program evaluation. In conversation with policymakers, funders, and their communities, librarians often have difficulty talking about what we do in terms of concrete benefits; instead, we often default to the loftiest of our many missions: defending democracy, advancing freedom of thought, instilling the love of reading.... While these deeply held values of our profession should guide our ethics and decision-making, we still have a need and an obligation to measure what outcomes we can and demonstrate our impact on the multitudes who benefit from public libraries in real and significant ways.
The language of evaluation
Inputs, activities, outputs, early outcomes, intermediate outcomes, end outcomes, impacts. Logic models. Evaluation questions. Theory of change. Indicators. This is the core vocabulary of program evaluation, and we would probably be hard-pressed to find a librarian today who hasn’t heard these terms and been asked to define them for a particular program.
Depending on what book about evaluation you happen to read, each of those words might be defined slightly differently; some might be used interchangeably and some might not be used at all. It’s a classification mess. No wonder so many library professionals get frustrated trying to squeeze what they do into a taxonomy with such mushy boundaries.
Though the names are often confusing, the idea behind them remains clear: public or nonprofit managers need to be able to show what they’re doing and how it is beneficial to their stakeholders in numerical terms—as indicators. Indicators are at the core of all we try to do when we’re evaluating. In many ways, logic modeling, evaluation questions, and theory of change work are all methods to help us develop indicators.
How we count
An indicator is a measure that something has happened—it indicates (points to) that something happened in one place that had an effect on something else. Sometimes the thing that happened can be measured directly, by an indicator such as the number of public Internet sessions hosted on library computers per day. To measure this indicator, you simply need to count up the number of sessions.
Yet at other times the thing that happened can only be measured indirectly; you have to sidle up to it. An indicator such as the number of people who were helped by someone else using a public Internet connection is an example of something that can only be measured indirectly. You can’t reliably learn this directly—the people who were helped may or may not know that they were helped because someone used a public Internet connection on their behalf, and even if they do happen to know, you may not have access to them to ask.
Indicators need to be hearty. Besides actually measuring something important and actionable, they need to meet certain utilitarian standards. They should be:
- Specific and unique
- Observable and measurable
- Cost-effective to collect
- Understandable and relevant
- Valid and reliable
- Time bound.
What to collect when you’re collecting
Oftentimes, librarians choose methods for data collection before they choose indicators, and usually the go-to choice for data collection is a survey. That can create a problem, since instead of thinking about what should be measured, usually the time available is spent trying to think up survey questions.
A better approach is to use logic models, evaluation questions, and theory of change work to develop valid indicators and then figure out how to collect the right data. You might be surprised at how much data you can collect for indicators without asking a single survey question—letting you save your survey questions for measuring things that really make a difference in decision-making and advocacy and can’t be known any other way.
Logic models
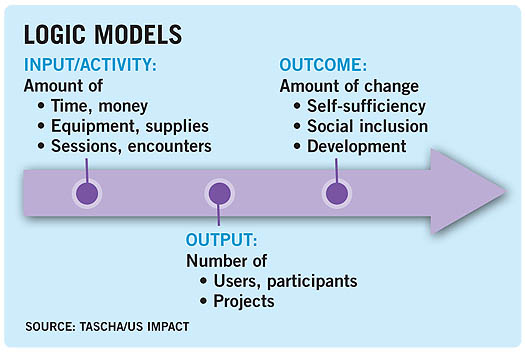
In evaluation, the logic model is used to help structure indicators around a framework that reflects a certain linear way of thinking about a program. Indicators are developed for inputs and activities to measure what resources are being used and what they’re being used for; outputs to see how much the inputs and activities are being used by the target audience; and outcomes to measure how much change is occurring in people or communities as a result of the outputs.
While this approach is very helpful for organizing program information and standardizing it for internal and external audiences, many times, managers get hung up trying to differentiate between activities and outputs, outputs and outcomes, and no one is quite sure where an outcome ends and impact begins. Rather than making too much of the finer points, using them mainly to help identify and organize good indicators will probably help get past model-jams.
The nice thing about logic models is that they get everything in one place and can be looked at easily. One of the powers of being able to see a program this way is that it can help identify areas where other organizations overlap libraries either in the activities they provide or the outcomes they are aiming to achieve. This can be valuable when trying to figure out partnerships—relating to the partner’s logic model is a powerful way of showing common goals and structuring resource sharing.
Theory of change and evaluation questions
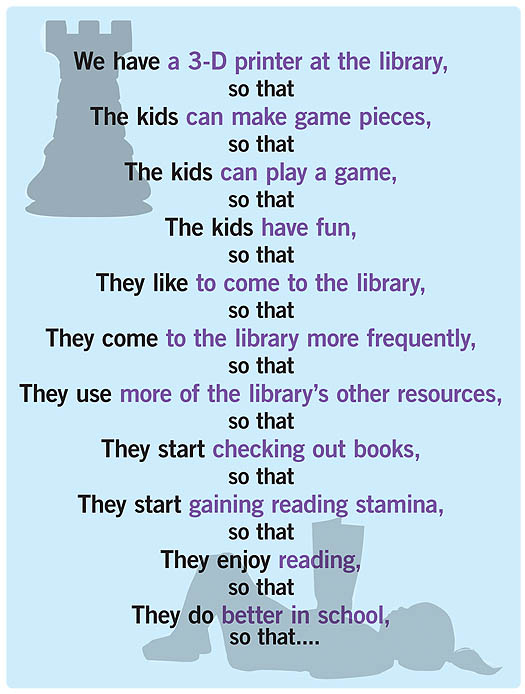
Theory of change work is another way of organizing indicators and structuring program information. Instead of using the logic model, the program is connected through a series of “so that” statements that show a progression of steps an individual takes through a program and the change each step is to encourage along the way. The logic model can also be overlaid on the theory of change.
The theory of change approach can be helpful if a program is started because someone had a great idea, but no one is quite sure how or whether it will work. In that case, sometimes it’s easier to use the theory of change backward, starting by asking what program participants need to know, have, or do in order to improve their lives or their communities and then working back into your program design.
An example that is seen a lot these days: someone wants to create a Maker space. A local foundation is willing to give a grant, but the library has to fill out a logic model and explain how success will be measured. Many librarians will start with what goes into the Maker space and then what kinds of programs will be held there. Yet when it comes to defining outcomes, they are stumped. “I just want the kids to have fun. How do I define fun as an outcome?” is a common refrain heard at library conferences (and in private mutterings over grant applications).
Theory of change work helps break through these blocks. It asks how and why over and over again until responses are exhausted. If it can’t be defined as a measurable outcome, it hasn’t been sufficiently interrogated.
Having fun is a worthy and measurable indicator of a satisfying event or program—it’s an output in this context—but an outcome needs to be connected to a higher level goal that resonates with the community and funders, and the indicator needs to be specifically connected to that. That doesn’t mean you have to (or can) prove that coming to a library Maker space leads to better school performance, but it means that you can show, theoretically, how your program could contribute to better school performance.
Testing the theory
The theory of change also tells you what to measure—you are testing your theory.
- Can the kids make the 3-D game pieces? How many did they make?
- Did the kids play the game? How many played? How many came back to play again?
- How many came to the library for other reasons? How many times? What else did they do?
These questions, your evaluation questions, lead easily to indicators:
- The number of participants who successfully made at least one game piece.
- Total number of game pieces made. Amount of printing material consumed.
- Number of participants who played the game. Number of return participants.
- Number of participants who visited the library outside of game night.
When first doing this work, it’s best to write down most every indicator you can think of that can answer your evaluation questions and prove or disprove your theory of change. Then, starting with whether the indicator measures something that matters, start whittling down the list, getting rid of what doesn’t meet the criteria for a good indicator. Once that’s done, methods for data collection can be considered, with survey questions reserved for indicators that can’t be collected by any other method.
A final word: be creative with your methods. Want to know how many unique program participants you have? Try a loyalty card. Want to know how many participants in a digital literacy class learned how to send email? Have them send a message to the library with a particular subject heading and keep a log.
Developing common indicators
Indicators are hard to develop. There are many approaches to figuring out which to measure and just as many methods for collecting data about them. It’s no wonder, then, that a legion of consultants and academics make a living trying to help organizations do all this measuring.
Among them are researchers, like those at TASCHA/US IMPACT, whose work involves developing common indicators that can be shared among public and nonprofit groups that perform largely similar functions. Researchers at TASCHA/US IMPACT focus on indicators related to public libraries, digital inclusion, and information and communications technology in the United States and internationally. Common indicators are developed to save the time and resources of organizations involved in the public good from going toward developing duplicative measurement systems—or, as it’s better known, reinventing the wheel.

Opportunity for all indicators
The intention behind Opportunity for All, aside from gathering national data about the impact of public access technology in public libraries, was to develop a set of indicators that could help to measure how library patrons used public Internet connections (through a library computer or through a public Wi-Fi connection) and how having public access helped them in their lives.
Though indicators about inputs, activities, and some outputs had been developed through the Institute of Museum and Library Services Public Library Survey, the Public Library Funding and Technology Survey, and other public library efforts, none had yet been developed that looked at the outcomes of public access use.
To figure out what to measure, we gathered a group of experts from within and outside the library world. We invited library leaders, researchers, organizations, and educators; we asked experts in city/county government, development, and evaluation to bring a different perspective, methodologies, and expectations to our task. The latter group proved critical to helping us design measurements that would resonate with policymakers and funders.
We also talked with librarians and public access users to find out how public access worked—how having computers in libraries changed people’s lives. Among many important findings, we learned about the important role of librarians to users achieving their goals with technology; we learned how public technology users help family and friends by accessing information on their behalf; and we learned that the use of social media and communications bring about some of the most noteworthy outcomes.
The indicators ultimately created to measure public access technology outcomes across eight domains were deployed in 2009 as a telephone survey and a supplementary web survey. What was at first only intended to help gather additional data for one study, instead became a model for how common indicator projects can be taken one step further by also providing a common platform from which to gather indicator data.
Impact Survey across the years
Reinventing the wheel of defining program indicators when library programs share so many commonalities is wasteful and inhibits the library field from aggregating results and showing our collective impact. The Impact Survey was developed to put the Opportunity for All outcome indicators for public access technology into practice by providing a data collection application to go along with it.
In 2011, as a result of a generous grant from the Gates Foundation, the Impact Survey was redeployed with new self-service tools intended to test whether libraries would continue to use the tool, and the Opportunity for All indicators, if provided an easy way to field it locally. In that deployment, over 200 libraries collected surveys from approximately 30,000 public access users.
In 2014, the survey was again deployed, this time with the intention of keeping it going and adding other outcome indicator–driven surveys about other aspects of public library services and also to open it up to other kinds of libraries and nonprofit organizations. In its first year, the third iteration of the public technology survey collected more than 44,000 surveys.
The results show some changes in how patrons use library technology over the past six years, as well as areas where use has remained stable. Though results from web surveys are not generalizable, and the libraries that participated in the survey varied in each deployment, it is worth noting some possible trends in use patterns that could prompt further investigation.
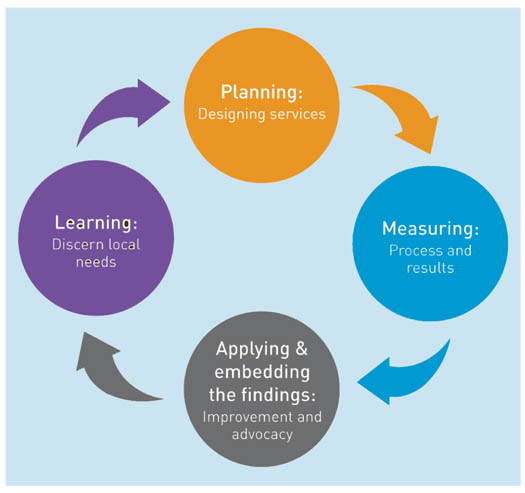
ASSESSMENT LIFE CYCLE Developed by the Bill & Melinda Gates Foundation, whose indicators were incorporated into the Impact Survey tool, the Global Libraries impact planning and assessment model shows the role of assessment in a self-reinforcing cycle of continuing improvement
Access elsewhere
One of the most surprising findings from Opportunity for All was that the 78 percent of public access technology users had access to the Internet at home, school, work, or somewhere else, not just at the library. In focus groups, interviews, and web survey comments, the users explained their reasons for using the library in addition to other access points:
- Limited/poor equipment, software, connectivity
- Household competition for access
- Reduce isolation/increase productivity (particularly for home workers)
- Away from home or traveling
- To look up book reviews and access library resources.
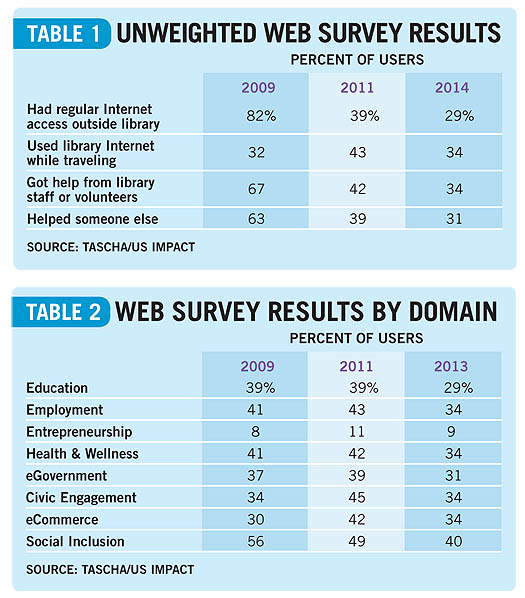
The unweighted web survey from 2011 and 2013 results remain close to the 2009 results around these indicators, and the number of users getting help from librarians remained relatively stable, while use during travel and use on behalf of others declined (Table 1). This could reflect greater adoption and use of handheld Internet devices such as smartphones and tablets that allow people to connect to the Internet through wireless networks.
Domain use
More change is seen over the past six years in terms of the areas of use. While those areas were mostly stable between 2009 and 2011, with some growth in civic engagement and eCommerce, the 2013 survey results show declines in use across all eight domains—in other words, the different kinds of thing patrons are using library computers to do (Table 2).
Within most of the domains, particular types of use have stayed stable or declined in concert with the domain results. Interestingly, in the employment domain, after hearing from web survey respondents in 2009 who reported that they were actually doing their jobs at the library through teleworking, we added an indicator about doing work at the library to the survey. In both 2011 and 2014, just under 20 percent of users reported using public Internet access for their jobs.
The main takeaway from looking back over the results from different periods of time where the Opportunity for All indicators were deployed through the Impact Survey platform, besides observations of shifting patterns of use, is that indicators need to be maintained. As we did in 2011 by adding an indicator about doing work in the library, we must keep pace with patrons about how they are benefiting from public technology and what emerging trends are appearing. We must also, as we did in 2014, remove indicators that are no longer useful because they are now done by too few people to bother counting.
Toward common indicators for libraries
Since Opportunity for All, many library organizations have taken up the challenge of providing indicators for libraries to use to measure their impact on patrons and their communities and to allow researchers and library advocates to aggregate library data to show our collective impact. At the iSchool, the late Eliza Dressang and her research team developed outcome indicators for story time on literacy development, while the Public Libraries Association’s (PLA) Performance Measures Task Force has been developing outcome indicators for story time and other library programs. Likewise, the International Federation of Library Associations and Institutions (IFLA) has been working on information literacy indicators for use in conjunction with the new United Nations Development Goals.
Development of common input, activity, and output indicators continues as well. The new Digital Inclusion Survey updates the Public Library Funding & Technology Access Study with new indicators to reflect the more advanced programs and services libraries are offering now, as well as their resource needs; the Edge Initiative provides indicators of library resources, services, and activities that are connected to better patron and community outcomes. Both Edge and the Digital Inclusion Survey come with tools to help with data collection and results dissemination.
Expanding impact
This trend of developing not just indicator sets but also tools to help libraries collect data and put it to use in advocacy and decision making is hopefully just starting. Since being identified by the Gates Foundation as one of three legacy partners, TASCHA/US IMPACT, along with PLA and IFLA, is deep in discussion about how to expand our work on impact measurement and the tools we have to offer so that more libraries worldwide will be able to get away from reinventing the wheel of evaluation and indicators and get to what they know best: transforming lives and communities. Could now be the time for something like a Cochrain Collaborative for public libraries that reviews and disseminates synthesized best practices? Imagine the possibilities.
THE MAKING OF IMPACT
For more on LJ’s evolving coverage of the Impact Survey and the influence it has had on the field of librarianship, see “Impact Survey Aims To Help Libraries Increase, Explain Their Worth” and “Measuring Outcomes” (Impacts & Outcomes, LJ 2/15/14, p. 22).
Add Comment :-

Added To Cart
RELATED


RECOMMENDED


TECHNOLOGY

ALREADY A SUBSCRIBER? LOG IN
We are currently offering this content for free. Sign up now to activate your personal profile, where you can save articles for future viewing
ALREADY A SUBSCRIBER? LOG IN
Thank you for visiting.
We’ve noticed you are using a private browser. To continue, please log in or create an account.
